Introduction
Only last month share markets in the US and Australia were at record highs. But ever since President Trump ramped up the US-China trade war again at the start of August, financial markets have seen a significant increase in volatility. Share markets have had 6% or so falls from their highs to recent lows and bond yields have plunged to new record lows in many countries. This note takes a looks at what is driving the market turmoil, the risk of recession and what it all means for investors.

Market turmoil – what’s driving it
The bout of market turmoil we have been seeing this month basically has three inter-related drivers. First, President Trump ramped up the US-China trade war again with another round of tariffs on China. (See Escalating US-China trade war).
Second, Chinese economic data slowed more than expected in July and the manufacturing heavy German economy contracted in the June quarter. This is on the back of weak global data.
Third, economic uncertainty drove more money into bonds pushing bond yields down and driving a further “inversion” of bond yield curves – which is when long-term bond yields fall below short-term yields – leading to more talk of recession.
This all drove share markets down. Of course, the turmoil in Hong Kong, Brexit, tensions with Iran, political uncertainty in Italy and increasing risks that a Peronist government will return in Argentina aren’t helping. Talk of policy stimulus has provided some relief though with occasional sharp rallies in shares.
Australia is not in the trade war but anything that weakens global growth threatens our exports and confidence, so we are naturally seeing bouts of weakness in Australian shares and bond yields just like we did last year when the trade war started.
Reasons for concern
There are several reasons for concern. First, the trade war still shows no sign of letting up. Optimism on US trade talks with China have been dashed several times now, the threat of tariffs on autos remains and maybe China has decided to wait till after next year’s US elections.
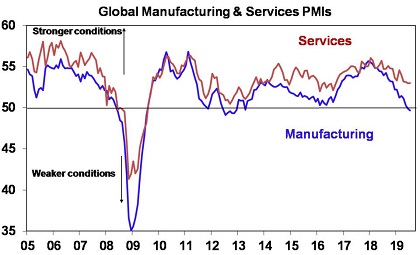
Second, the trade war and the twists and turns it takes is weighing on business confidence and it’s hard to make firm investment plans when they may be rendered uneconomic by a tweet from Trump. This is particularly evident in a slump in manufacturing conditions PMIs worldwide. See the next chart.

Source: Bloomberg, AMP Capital
Third, it’s been hoped Chinese policy stimulus will offset the trade war for the last year now, but China has continued to slow.
Fourth, inverted yield curves have preceded post-war US recessions so the recent inversion can’t be ignored.
Finally, global and Australian share markets are vulnerable to weakness after roughly 25% gains from their December lows to their July highs left them overbought and vulnerable to a correction. This risk is accentuated as the August to October period often sees share market weakness.
Reasons for optimism
However, while the risks have increased there are several reasons not to get too concerned. First, President Trump is getting twitchy about the negative economic effects of the trade war: he delayed some tariffs last week after sharp share market falls and had a meeting with major US bank heads on share market falls. The historical record shows that US presidents get re-elected after a first term (think Nixon, Reagan, Clinton, Bush junior and Obama) except when there were recessions in the two years before the election and unemployment is rising (think Ford, Carter and Bush senior). Trump would be aware of this. Share markets have regular corrections but major bear markets are invariably associated with recession and so Trump is wary whenever shares take a sharp lurch lower. As a result, our view remains that at some point Trump will seek more seriously to resolve the trade issue.
Second, policy stimulus is being ramped up: with numerous central banks now cutting interest rates and indicating that more cuts are on the way including from the Fed; the ECB looks like it will soon return to quantitative easing; Chinese economic policy meetings indicate that more policy easing is on the way; Germany is reportedly thinking about some sort of fiscal stimulus; and there is talk of more US tax cuts. This is very different to last year when the Fed was tightening, the ECB ended QE and other central banks including the RBA looked to be edging towards tightening.
Third, while the risks have increased, a US or global recession remains unlikely: services indicators have held up well (see the first chart) and the services sector is the dominant part of most major economies; we have not seen the sort of excesses that precede global and notably US recessions – there has been no investment boom, private sector debt growth has been modest and inflation is low such that central bankers have not slammed the brakes on; & monetary & fiscal stimulus will provide support.
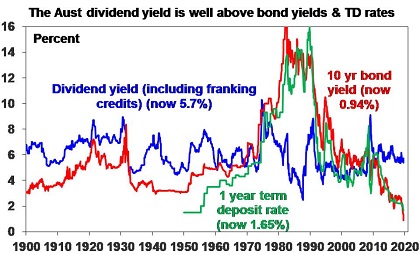
Finally, the decline in bond yields is making shares relatively cheap. The gap of 4.8% between the grossed-up dividend yield on Australian shares of 5.7% and the Australian 10-year bond yield of 0.94% is at a record high. Similarly, the gap between the grossed-up dividend yield and bank term deposit rates of less than 2% is very wide. In other words, relative to bonds and bank deposits shares are very cheap which should see them attract investor flows providing we are right and recession is avoided.

Source: Global Financial Data, Bloomberg, AMP Capital
But what about inverted yield curves?
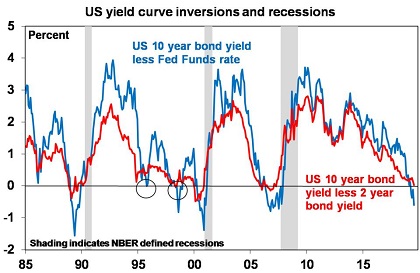
Long-term bond yields should normally be above short-term bond yields because investors demand a higher return to have their money locked away for longer periods. But sometimes long-term rates may fall below short rates. This happened briefly in the US in the last week in relation to the gap between 10-year and 2-year bond yields but had already happened a few months ago in relation to the gap between the 10-year yield and the Fed Funds rate. See the next chart.

Source: NBER, Bloomberg, AMP Capital
This so-called “inversion” is causing increasing consternation as an inverted US yield curve has preceded US recessions so it’s natural for investors to be concerned. But the yield curve is not necessarily a reliable recession indicator at present: it can give false signals (circled on the next chart); the lags from an inverted curve to a US recession averaged around 18 months in relation to the last three recessions so any recession may be some time off; various factors unrelated to US recession risk may be inverting the curve such as increasing prospects for more quantitative easing pushing down bond yields, negative German bond yields dragging down US yields and investor demand for bonds as a safe haven from shares; yield curves may be more inclined to be flat or negative when rates are low; and as noted earlier we have not seen other signs of an imminent US recession such as over-investment, rapid debt growth, excessive inflation and tight monetary policy. So our base case remains that a US recession is not imminent.
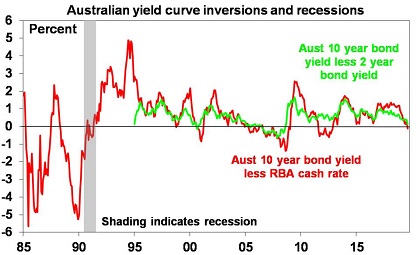
The Australian yield curve has also gone negative with 10-year bond yields of 0.94% below the cash rate of 1% but the gap between the 10 and 2-year bond yields only just positive. But it’s worth noting that Australian yield curve inversions around 1985, 2000, 2005-2008 and in 2012 were useless recession indicators.

Source: RBA, Bloomberg, AMP Capital
What does this all mean for investment markets?
In the short-term share markets could still fall further as trade and growth uncertainties remain and as we go through the seasonally weak months ahead. This could be associated with further falls in bond yields. In fact, further share market weakness may be needed to get Trump to seriously resolve the trade issue (as opposed to just go through another trade talks/ breakdown cycle again).
However, providing we are right and recession is avoided, a major bear market in shares (ie where shares fall 20% and a year later are down another 20% or so) is unlikely and given that shares are cheap relative to bonds we continue to see share markets as being higher on a 6-12 month horizon.
What should investors do?
Since I don’t have a perfect crystal ball, from the perspective of sensible long-term investing the following points are repeating.
-
First, periodic sharp setbacks in share markets are healthy and normal. This volatility is the price we pay for the higher long-term return from shares. After 25% or so gains from their lows last December shares were at risk of a correction.
-
Second, selling shares or switching to a more conservative strategy after falls just locks in a loss. The best way to guard against selling on the basis of emotion is to adopt a well thought out, long-term investment strategy.
-
Third, when growth assets fall they are cheaper and offer higher long-term return prospects. So, the key is to look for opportunities that pullbacks provide.
-
Fourth, while shares may have fallen in value, the dividends from the market haven’t. The income flow you are receiving from a diversified portfolio of shares remains attractive. So for those close to or in retirement the key is to assess what is most import – absolute stability in the value of your investments or a decent sustainable income flow.
-
Fifth, shares often bottom at the point of maximum bearishness. So, when everyone is negative and cautious it’s often time to buy.
-
Finally, turn down the noise. In times of crisis the negative news reaches fever pitch, which makes it very hard to stick to a long-term strategy, let alone see the opportunities.
If you would like to discuss any of the issues raised by Dr Oliver, please call on Ph: (03) 9557 1057 or email WE_CARE@TBAFINANCIAL.COM.AU.
Author: Dr Shane Oliver, Head of Investment Strategy and Chief Economist
Source: AMP Capital 20th August 2019
Important notes: While every care has been taken in the preparation of this article, AMP Capital Investors Limited (ABN 59 001 777 591, AFSL 232497) and AMP Capital Funds Management Limited (ABN 15 159 557 721, AFSL 426455) (AMP Capital) makes no representations or warranties as to the accuracy or completeness of any statement in it including, without limitation, any forecasts. Past performance is not a reliable indicator of future performance. This article has been prepared for the purpose of providing general information, without taking account of any particular investor’s objectives, financial situation or needs. An investor should, before making any investment decisions, consider the appropriateness of the information in this article, and seek professional advice, having regard to the investor’s objectives, financial situation and needs. This article is solely for the use of the party to whom it is provided and must not be provided to any other person or entity without the express written consent of AMP Capital.
