
Key points
– Trump’s tariff war has potentially another 6-9 months to go at least. This poses an ongoing threat to shares, but their relative resilience so far risks emboldening Trump to do even more.
– Even if Australian exports are not exempted from US tariffs the direct economic impact will be minor eg, steel and aluminium exports to the US are just 0.03% of Aust GDP.
– The RBA is expected to start cutting interest rates next week and trade war uncertainty adds to the case to cut.
– It could take till 2032 before Australian real wages get back to 2020 levels. Decent economic reforms could speed this.

Introduction
This note takes a look at some of the main questions investors have in a simple Q&A format, particularly around tariffs, the RBA and gold.
How long will the threat from Trump’s tariffs last?
So far, Trump has announced 25% tariffs on Canada and Mexico (then delayed them a month), a 10% tariff on China (which has commenced but may still be changed) and a 25% tariff on steel and aluminium applying to “everybody” which “may go higher”. And he is still vowing “reciprocal tariffs” (“they charge us. We charge them.”), tariffs on the EU and tariffs on other industries like cars, pharmaceuticals and semi-conductors and he is likely to do more after 1 April once his trade reviews are complete. All of these could have various twists and turns subject to deals and Trump’s whims and as such it feels very much like 2018 only this time Trump is moving faster, presumably because the US economy is now stronger, his administration is better organised, he wants revenue to pay for income tax cuts and he wants any pain over by next year’s mid-term elections.
What’s more, the motivation for the tariffs looks changeable with some justified by geopolitical aims like curtailing immigrants and drug flows, some aimed at reducing US trade deficits and some aimed raising revenue and shifting production back to the US. This implies some may be negotiated away eg the delayed tariffs on Canada and Mexico but others may end up being permanent (eg those on steel and aluminium and likely China and Europe). Trying to work out what will be permanent and what is not will be hard, resulting in uncertainty.
The tariffs impose a boost to US prices (which is worrying consumers & the Fed) and a hit to US and global growth as the tariffs disrupt supply chains, cut export demand & cause uncertainty which will cut investment. This will mean continuing volatility in shares, although so far shares have been resilient – with global and Australian shares around record highs – which may embolden Trump to do even more leading to a bigger correction. Ultimately, with deals and Trump constrained by any sharp fall in shares and a political backlash flowing from tariffs adding to cost-of-living in the US, average US tariffs are likely to end up somewhere around 9%, i.e. up from 3% last year but not quite the near 20% proposed in the election. Settling at this point could take at least 6-9 months or more.
US Tariff Duties Collected as a % of Total Imports
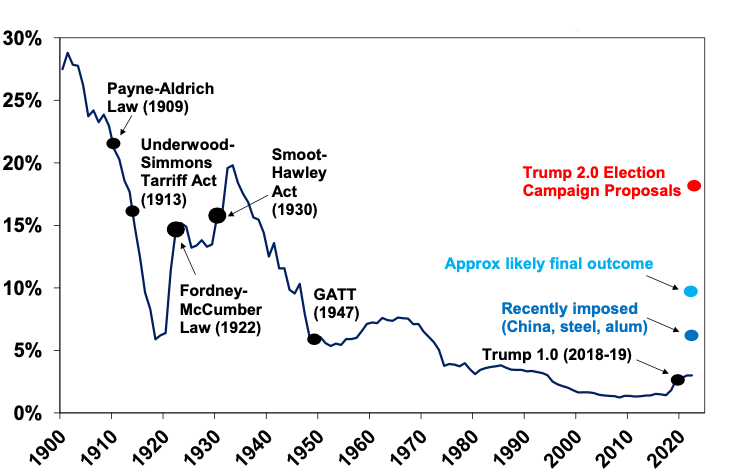
Source: US ITC, Evercore ISI, AMP
What will the tariffs mean for Australia’s economy?
With Trump now putting a 25% tariff on steel and aluminium imports from “everybody” there is a real concern Australia will be hit directly. Australia has a good case to be exempted as was the case in 2018 as we import twice as much from the US than we export to them but if Trump’s focus is on raising tax revenue and shifting production back to the US there is a risk that the trade deficit argument may not work this time. A call between Trump and Australian PM Albanese has led to an exemption being “under consideration.” But even if Australia is not exempted, while it would be horrible for the affected industries, the overall macro impact on Australia would be trivial. Eg steel and aluminium exports to the US total around $800m which is just 0.03% of Australian GDP. Overall total Australian exports to the US are less than 1% of total US goods imports and just 0.8% of Australian GDP. The main threat to Australia would come via Trump’s tariffs leading to less global trade and a hit to Chinese and global GDP, weighing on demand for our exports and hence our GDP.
US Imports
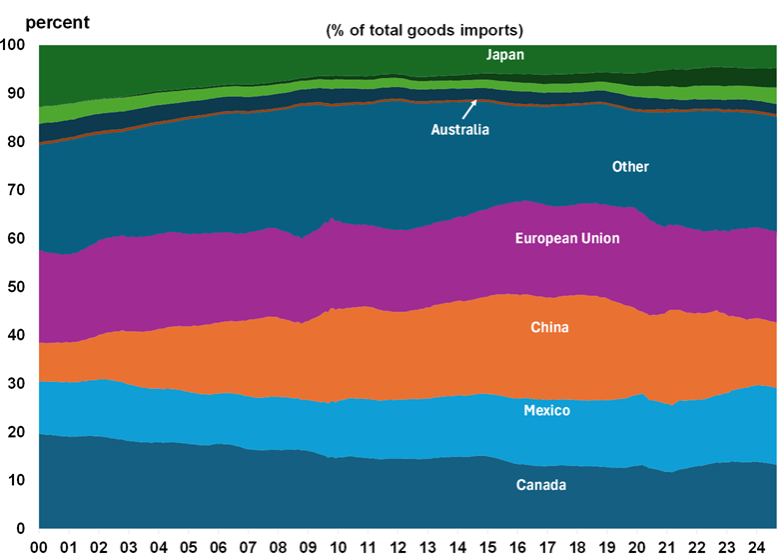
Source: Bloomberg, AMP
What is the risk of recession?
Trump’s trade war has arguably added to the risk of recession but if we are right and the average US tariff rate is capped below 10% of US imports then the hit to global and Australian economic growth should be contained to around 0.5%, which is not enough to drive a recession. And it is likely to be offset by other things including tax cuts & deregulation in the US and central bank rate cuts and lower currencies in other countries.
How likely is a February RBA rate cut?
The case for the RBA to start cutting rates soon is high and we think they will cut rates by 0.25% to 4.1% on 18th February. In the minutes to its last Board meeting in December, the RBA noted that “if the future flow of data continued to evolve in line with or weaker than [RBA] expectations…it would in due course be appropriate to begin relaxing the degree of monetary policy tightness”. Since that meeting: trimmed mean inflation, which is the RBA’s key focus, slowed meaningfully more than it expected to 0.5%qoq or 3.2%yoy in the December quarter; this implies an annualised pace of 2% over the quarter and 2.7% over the last six months which is in the target range; consumer spending has shown signs of picking up but the overall pace of growth appears to be running a bit below RBA expectations; unemployment remains low historically at 4% but there is no sign of a wages breakout with wages growth actually slowing; and the $A has fallen but the trade weighted index is in the same range it’s been in for four years. Yes, Trump’s latest trade war adds to uncertainty but absent retaliatory tariffs by Australia which is unlikely or a plunge in the $A it poses more of a downside threat to growth than an upside threat to inflation and so adds to the case for cutting rates.
Underlying inflation in Australia is now running around similar levels to other comparable countries that have already been cutting rates.
Global Core Inflation Rates
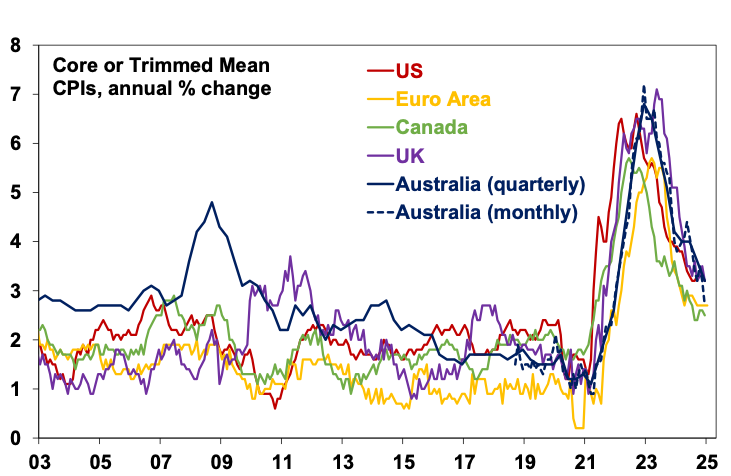
Source: Bloomberg, AMP
So, given all this we expect a first rate cut of 0.25% next week, a pause in April as low unemployment means that the RBA can be gradual in easing and then another cut in May with the cash rate hitting 3.6% in the second half. The money market is pricing a 90% chance of a cut in February (which seems high – 75% is more realistic) and most economists expect a cut, which is the first time the money market and economists have been expecting a cut at an upcoming meeting since the tightening cycle began.
Does this mean that the “cost-of-living” crisis is over?
No. Getting inflation back to target is not the same as saying the “cost-of-living” crisis is over. Yes, wages growth of 3.5%yoy is currently running above inflation of 2.4%yoy but over the last four years the average level of consumer prices is up 19% whereas the average level of wages is up just 14%. So, while Australians are starting to get ahead, their wages still buy less than they did four years ago. On our estimates assuming wages growth of 3.25% pa and inflation at the 2.5% pa target, real wages (and hence living standards) won’t return to their end 2020 level until 2032. A faster improvement would require more policy moves to boost productivity (like tax and labour market reform) which in turn will enable wages growth to run more ahead of inflation without actually adding to inflation. Hopefully the election due by 17 May will lead to this, but it seems unlikely, with the major political parties so far not offering a major change in policies towards a productivity enhancing reform agenda.
Australia Inflation vs Wages
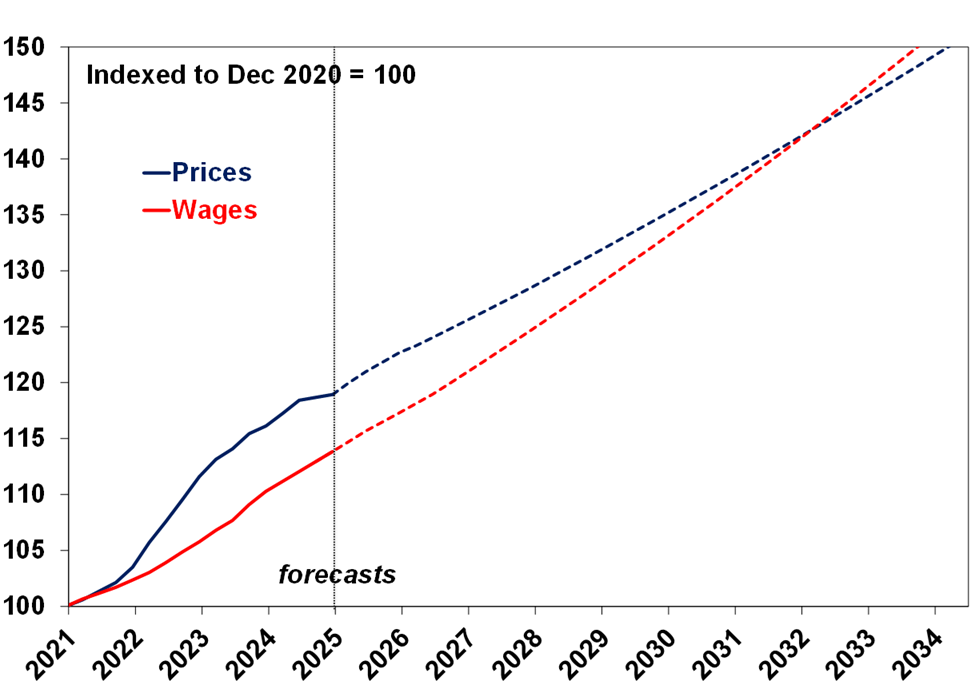
Source: ABS, AMP
What about China?
China continues to face big challenges: a falling population; trying to get consumer spending to take over as a key growth driver; and political tensions with the West which have escalated again with the return of Trump. Taken together they imply a slowdown in China’s long term growth rate. Trump 2.0 tariffs could further depress Chinese growth this year but if they are limited to say 20% as opposed to the 50-60% Trump was proposing in the election China should be able to offset their negative impact (about 0.9% of GDP) with policy stimulus. All up we see China muddling along again with growth just below 5% this year. Chinese shares are still cheap after their bounce last year with a PE of around 15 times, but geopolitical and economic risk remains high.
How big a threat are geopolitical risks?
Geopolitical risk remains high this year: with Trump (via maximum pressure) and Israel likely to try and do something about Iran’s nuclear ambitions (which could threaten oil supplies); Trump likely to try and bring the Ukraine war to an end; and tensions with China remaining high. The trouble is that geopolitical risk always seems high lately and trying to time it and quantify what it means is very hard. But it risks contributing to a more constrained and volatile ride in investment markets this year.
What’s driving the $A?
The $A has fallen 10% or so against the $US from a high of around $US0.69 last September, reflecting the anticipation and then reality of a Trump victory leading to a new round of tariffs and a lessening of Fed rate cut expectations just at the time investors have become more confident in RBA rate cuts. The $A is likely to be buffeted between changing perceptions as to how much the Fed will cut relative to the RBA, the negative impact of US tariffs and a potential global trade war and the potential positive of more decisive stimulus in China. This could leave it stuck between $US0.60 and $US0.70, but with the risk skewed to the downside if Trump continues to ramp up tariffs.
Why is the gold price at record levels?
The gold price in US dollars is up 44% over the 12 months. Its surge reflects a combination of ongoing central bank buying to diversify away from the $US, safe haven demand (where it’s working better on this front than Bitcoin) and positive momentum driving more buyers. With liquidity conditions likely to remain positive as central banks cut rates further, it’s likely to remain strong, particularly if the $US starts to weaken.
Dr Shane Oliver – Head of Investment Strategy and Chief Economist, AMP
Important note: While every care has been taken in the preparation of this document, AMP Capital Investors Limited (ABN 59 001 777 591, AFSL 232497) and AMP Capital Funds Management Limited (ABN 15 159 557 721, AFSL 426455) make no representations or warranties as to the accuracy or completeness of any statement in it including, without limitation, any forecasts. Past performance is not a reliable indicator of future performance. This document has been prepared for the purpose of providing general information, without taking account of any particular investor’s objectives, financial situation or needs. An investor should, before making any investment decisions, consider the appropriateness of the information in this document, and seek professional advice, having regard to the investor’s objectives, financial situation and needs. This document is solely for the use of the party to whom it is provided.